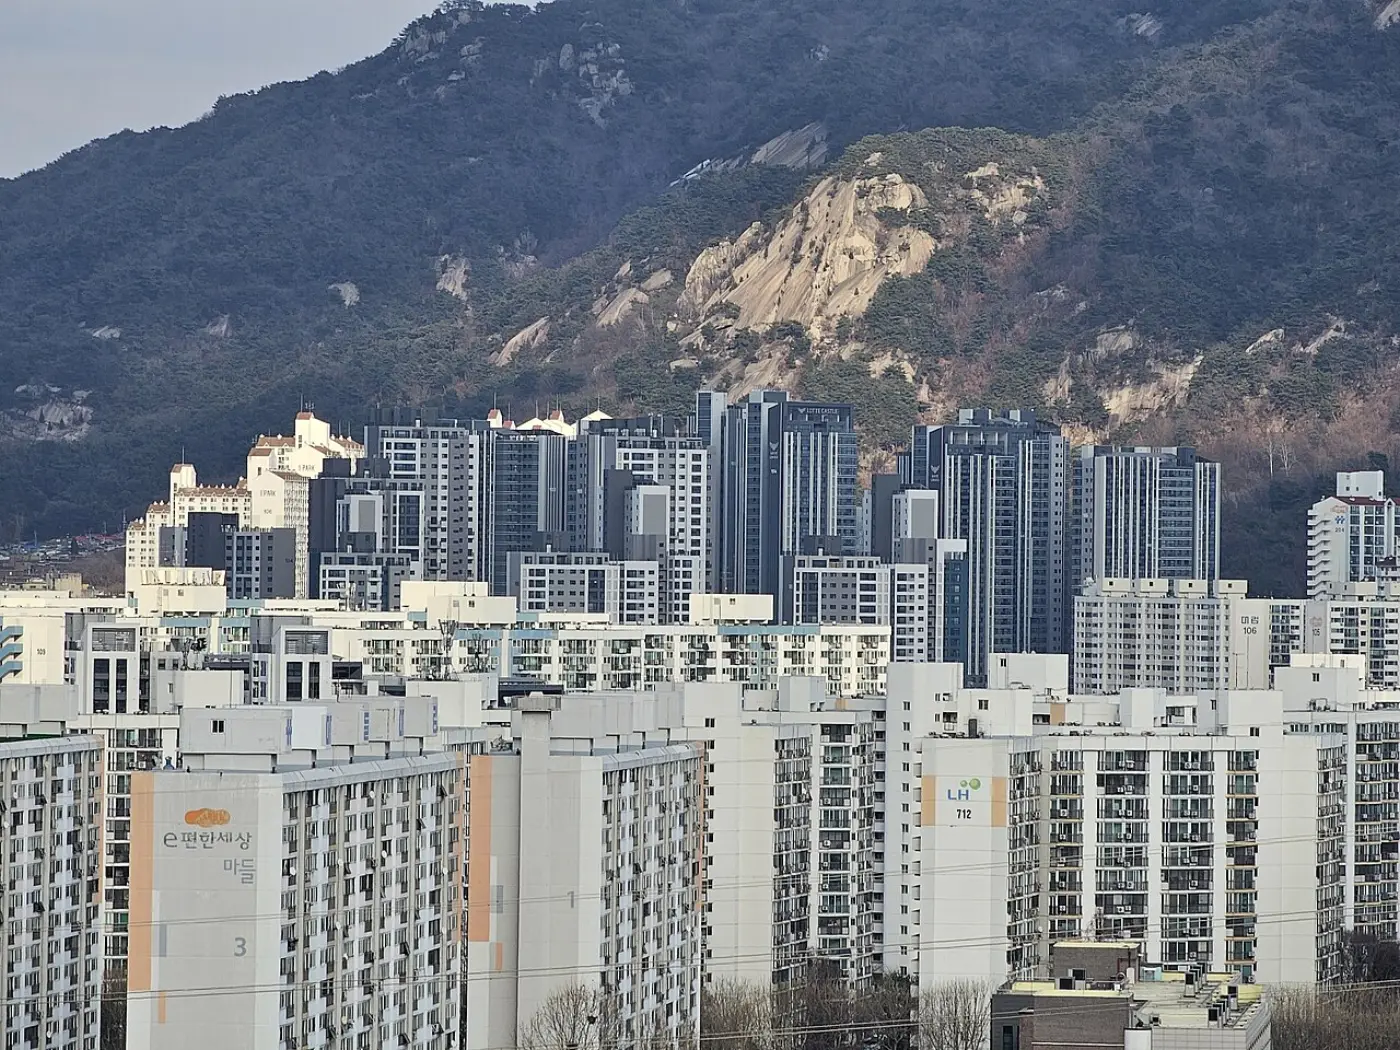
The short answer: 514 people per km², about 28th in the world
Korea's population density in 2024 was 514 people per km². Index Nuri, Korea's national indicator portal, puts this at about 28th in the world among 237 countries. The ranking by population size comes from a projection Statistics Korea published in 2015, which expected Korea to rank 31st in the world by population in 2030. A Statistics Canada table comparing OECD member countries also shows Korea as more densely populated than the Netherlands and Japan.
Population density is a region's population divided by its land area, so it tells you how many people live in each square kilometre. A population ranking looks only at the number of people, while a density ranking looks at both people and area. Because of this difference, the two rankings can be seen as figures to be read separately.
Population size in Statistics Korea's projections: 51,682,000 in 2025, then decline
Statistics Korea projections published on Index Nuri put Korea's total population at 51,673,000 in 2022. The population rises to about 51,682,000 in 2025, then declines to a projected 46.27 million in 2052. Another release from the Ministry of Data and Statistics (formerly Statistics Korea) gives Korea's population as 52 million in 2024 and projects 36 million in 2072. In the same release, the world population grows from 8.16 billion in 2024 to 10.22 billion in 2072.
In a 2015 release, Statistics Korea projected Korea's population at 52 million in 2030, which would rank 31st in the world. The same release estimated that South and North Korea combined would have 79 million people in 2030, ranking 21st. It also projected that Korea's population would fall from 51 million in 2015 to 44 million in 2060.
Taken together, these figures show Korea's population shrinking while the world's grows. Korea's population ranking can therefore change depending on the reference year. Note also that the projections in the 2015 release and the 2024 release differ.
Index Nuri's 2024 density figure: 28th of 237 countries
Index Nuri's population density indicator states: "In 2024, Korea's population density was 514 people, about 28th in the world (237 countries)." The indicator is based on Statistics Korea's population projections and the Ministry of Land, Infrastructure and Transport's cadastral statistics.
One set of official estimates used for international comparison is the UN's World Population Prospects. The 2024 revision is the 28th edition, prepared by the Population Division of the UN Department of Economic and Social Affairs. The UN has published these estimates since 1951. The edition provides population estimates for 237 countries and areas from 1950 to the present, drawing on 1,910 national censuses and 3,189 sample surveys conducted between 1950 and 2023, among other sources. It also offers projections to 2100 and puts the probability that the world population will peak within this century at 80%.
A rank of 28th only means something when you know how many countries it is out of, which is why Index Nuri's note of a 237-country comparison arguably matters. The originals can be read on Index Nuri's population density indicator page and on the UN Population Division's World Population Prospects website (population.un.org/wpp).
Statistics Canada's OECD table: Korea 502, the Netherlands 484, Japan 350
Statistics Canada published the population densities of OECD member countries in a single table, compiled from the OECD's 2010 country statistical profiles and the CIA's The World Factbook 2009. The table gives Korea's 2008 population as 48,607,000.
Here is how three countries in the table compare. Korea joined the OECD in 1996 and has a density of 502 people per km². The Netherlands joined in 1961 and has 484 people per km². Japan joined in 1964 and has 350 people per km². Within this table, Korea is the most densely populated of the three.
Eurostat, the EU's statistical office, gives the Netherlands' population density as 498 people per km², which it describes as the second highest in the EU after Malta. The same country thus appears as 484 in one table and 498 in another. The gap shows why cross-country comparisons should use figures from the same table and the same point in time. Korea's 2024 figure of 514 and the table's 502 also refer to different years.
Density by province in 2025 and the capital region's 51.0% share
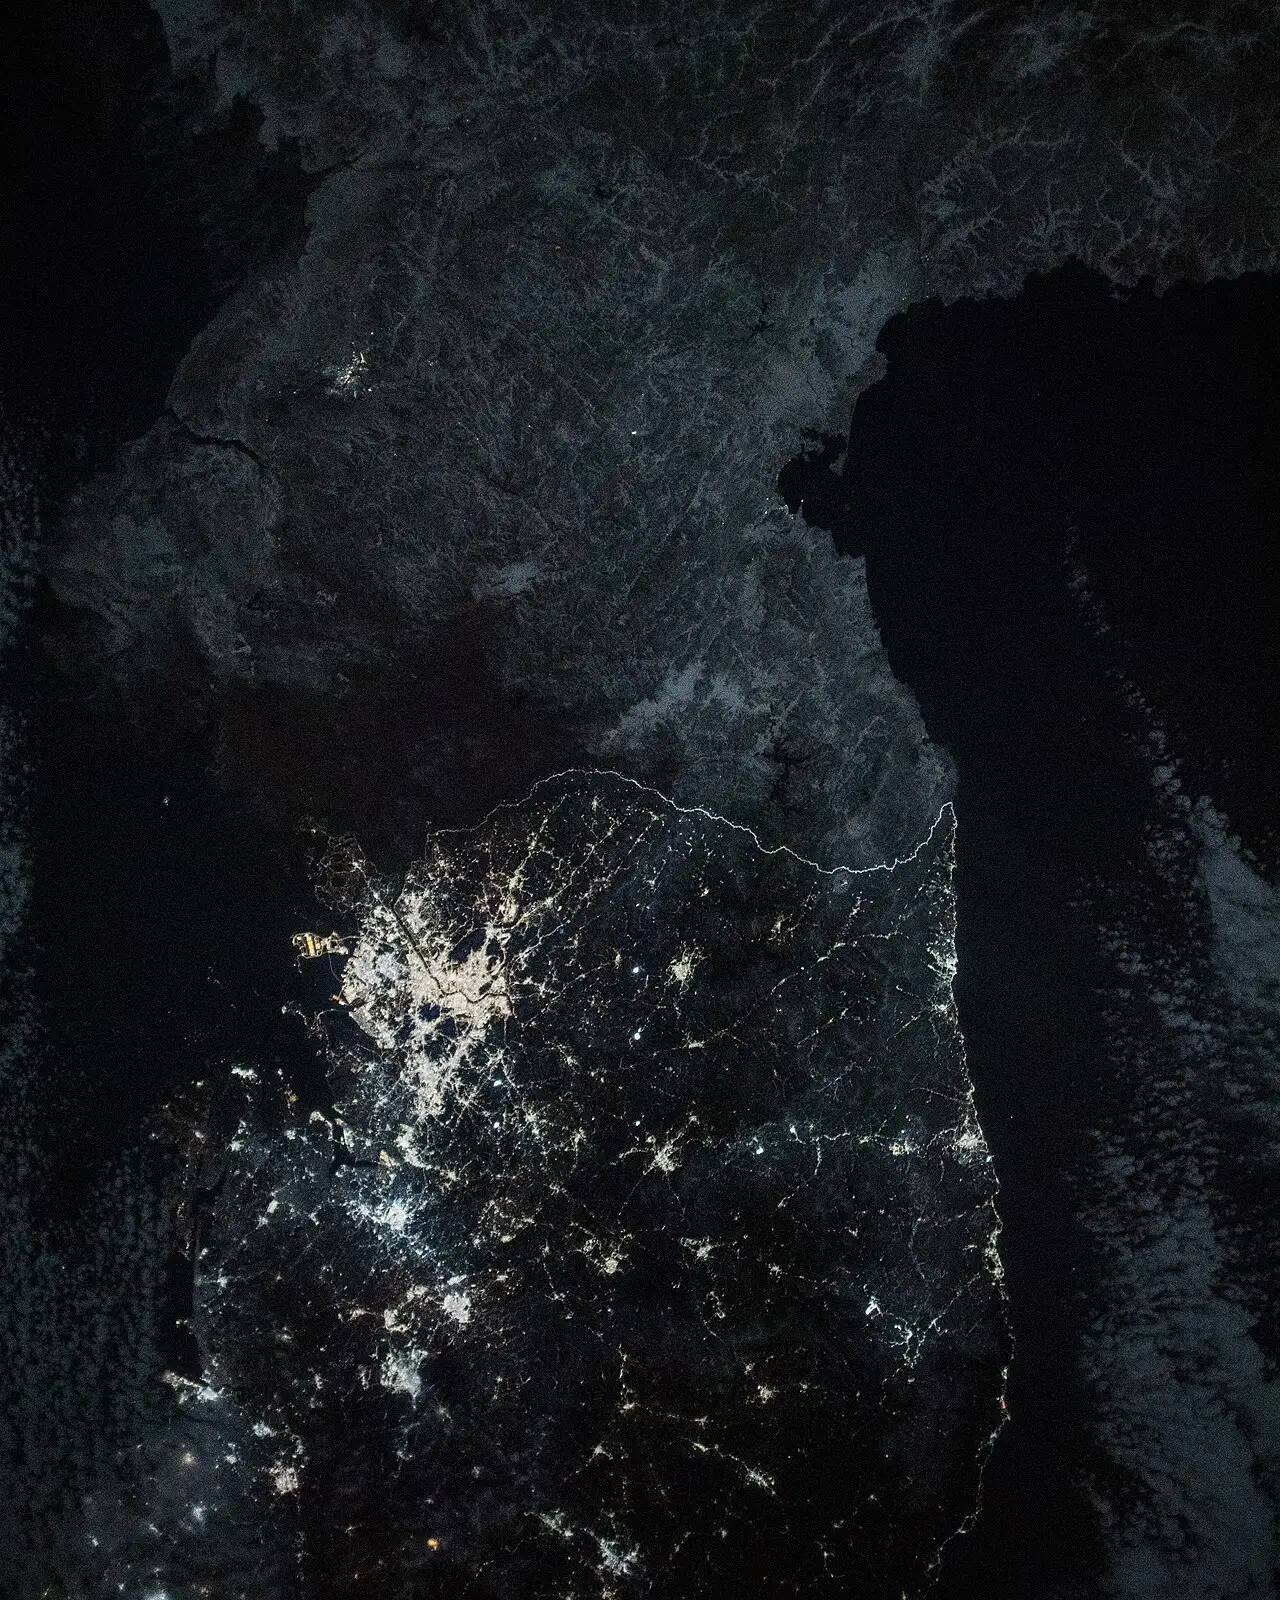
According to Index Nuri, population density in 2025 varies widely by province and city. Seoul (15,432 people per km²) and Busan (4,197 per km²) are high, while Gangwon (90 per km²) and North Gyeongsang (136 per km²) are low.
In 2025, the capital region had 26,347,000 people, or 51.0% of the national population. Its density was 2,219 people per km², up 4 per km² from the previous year and 95 per km² from 2014.
Asia Economy reported on an analysis by Japan's Nikkei (Nihon Keizai Shimbun, 日本経済新聞), which compared 37 OECD countries using the UN's World Urbanization Prospects 2025. In that analysis, Korea's capital-region share of the population was the highest, at 43.3% in 2023, up 1.2 percentage points from 42.1% in 2010. The average across the 37 OECD countries peaked at 16.9% in 2021 and has since declined. Index Nuri's 51.0% and the analysis's 43.3% come from different sources and different reference years. The national average of 514 arguably hides the wide gap between Seoul and Gangwon.
| Country or region | Population density (people/km²) | Source |
|---|---|---|
| Korea (2024) | 514 | Index Nuri population density indicator |
| Korea (2008) | 502 | Statistics Canada OECD table |
| Netherlands | 484 | Statistics Canada OECD table |
| Japan | 350 | Statistics Canada OECD table |
| Netherlands | 498 | Eurostat |
| Seoul (2025) | 15,432 | Index Nuri population density indicator |
Summary
Put together, the data split Korea's position into three questions: its rank by number of people, its rank by density once area is factored in, and where within the country the population is concentrated. Each question has to be answered with different data and figures from different years. The Netherlands appearing with a different density in each table illustrates the point well.
The next thing to look for is a table of OECD member densities for the latest year, compiled on a single basis. It is also worth checking in the originals how the area figures from the Ministry of Land, Infrastructure and Transport's cadastral statistics feed into the indicator. On the ground, you can compare the streets of Seoul, at 15,432 people per km², with those of Gangwon, at 90 per km².