The short answer: northwest winds versus North Atlantic heat transport
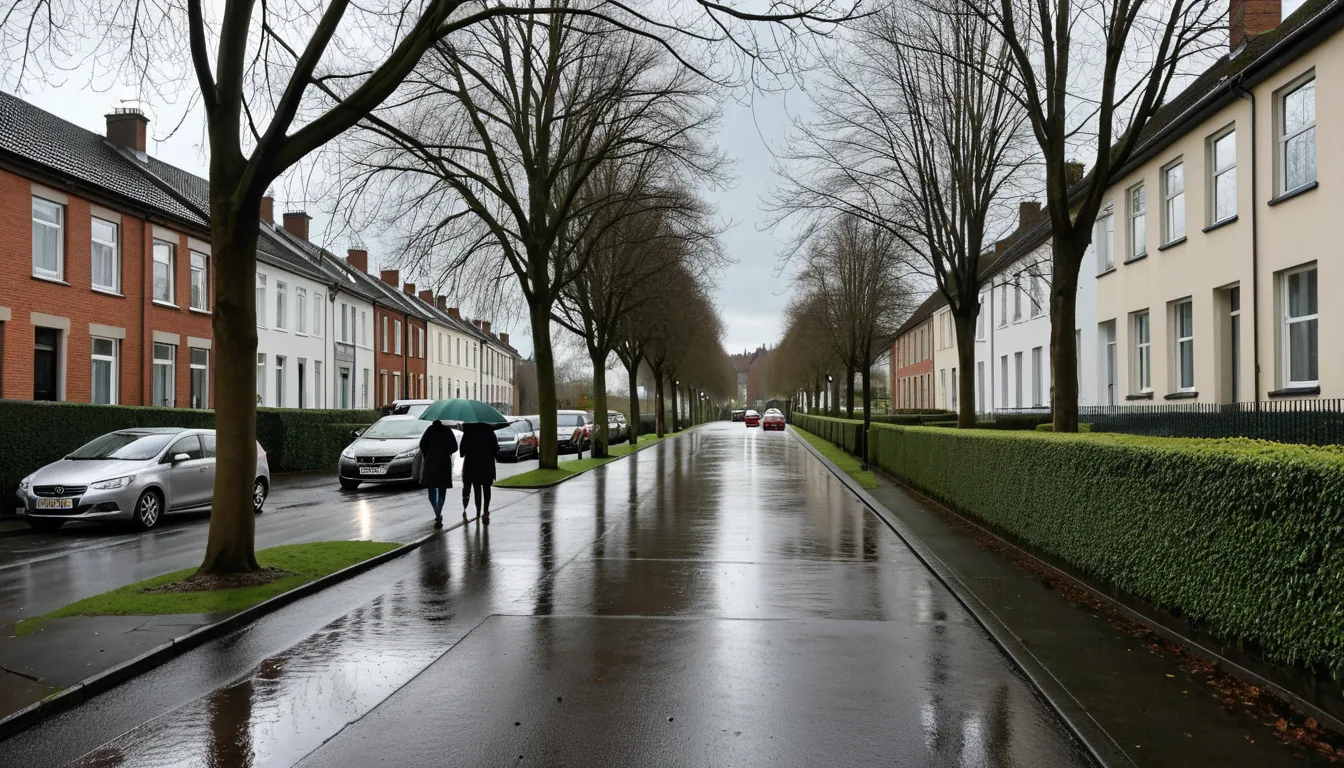
Seoul's winter is colder than London's because the air and the ocean acting on each city are different. The Korea Meteorological Administration (KMA) sums up Korean winters in a single sentence: "In winter, under the influence of a cold, dry continental high, the weather is cold and dry." That line comes from the description of Korea's climate on the KMA's climate statistics site, and the same agency's regional statistics put Seoul's January mean temperature at -1.9°C.
London's mild winter has a different explanation: heat transport in the North Atlantic. The Met Office Hadley Centre notes that northward heat transport gives Western Europe a mild climate compared with northeastern North America, and NOAA adds that the Gulf Stream extends toward Europe, warming the countries of Western Europe. UK Met Office normals put London Heathrow's 1991–2020 January mean minimum at 2.68°C. The two agencies use different statistical measures, though, so the numbers cannot simply be laid on top of each other.
What the KMA's climate statistics show about January in Seoul and Paju
The KMA explains that Korea lies in the mid-latitude temperate zone, which gives it four distinct seasons. Northwesterlies dominate in winter and southwesterlies in summer, a clear seasonal shift in the prevailing wind regime. In the 1991–2020 normals, January is the coldest month, with monthly mean temperatures by region ranging from -6.9°C to 3.6°C — a range that excludes island areas such as Ulleungdo.
The figures for Seoul are more specific. The KMA's regional climate statistics give the city an annual mean temperature of 12.8°C, with January the coldest month at -1.9°C and August the hottest at 26.1°C, an annual range of 28.0°C. Winter precipitation for December, January and February totals 67.6 mm, about 5% of the annual total, and the normal date of first ice is 3 November, first snow 20 November. Paju, in Gyeonggi Province, has a January mean of -4.6°C and an annual range of 29.5°C.
Why monsoon winds reverse: Seoul's prevailing winds, 1963 to 2019
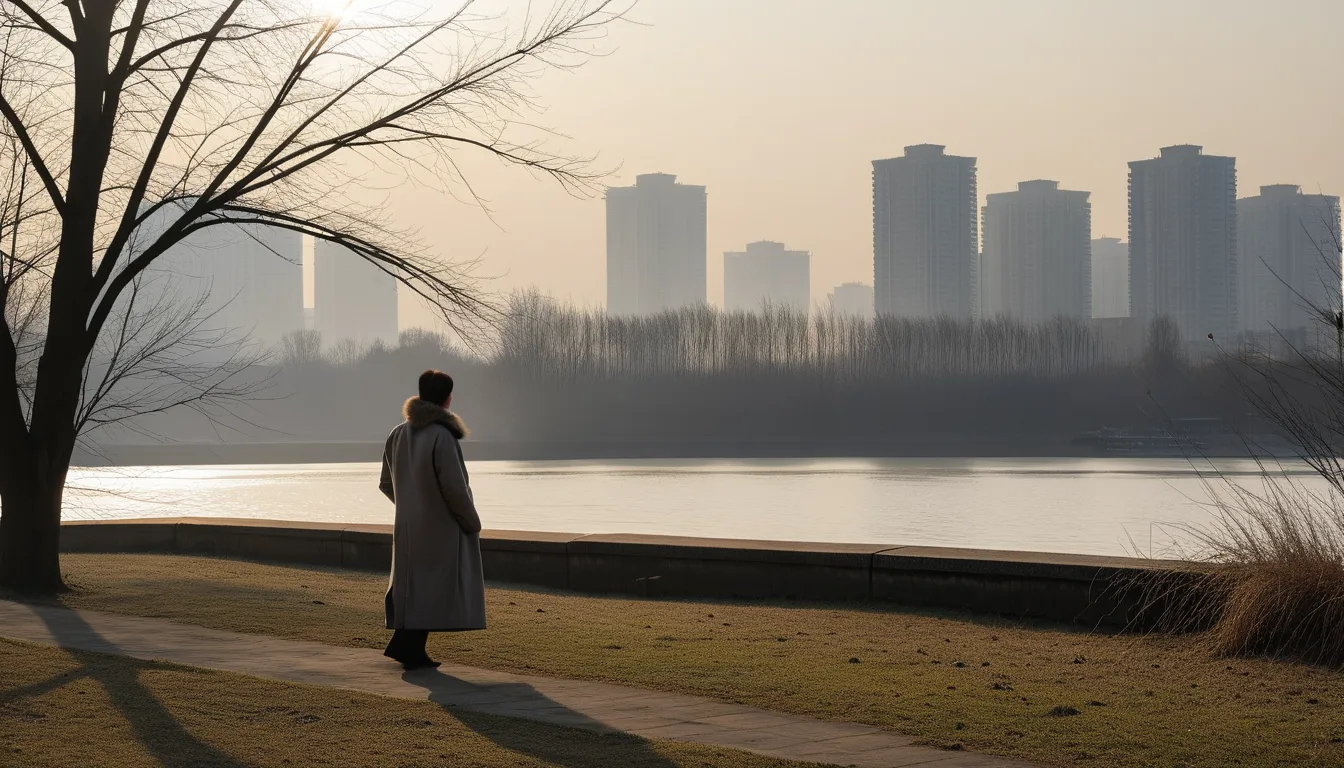
The KMA's children's weather classroom explains monsoon winds in plain terms: they blow from sea to land in summer and from land to sea in winter. The direction reverses because land and sea differ in temperature — in summer the land becomes hotter than the sea, and in winter it cools faster. In winter, the KMA explains, the Siberian high to the north develops strongly and sends cold, dry air toward Korea. The agency calls this wind the "northwest monsoon."
The Journal of Climate Change Research, published by the Korean Society of Climate Change Research, carries a paper on Seoul. Because the city lies in the western part of the Korean Peninsula, the authors note, it is strongly affected by the Siberian air mass in winter. Over the 57 years from 1963 to 2019, west-northwest winds were the prevailing wind in 31 Decembers, 32 Januaries and 30 Februaries — roughly 55%, by the paper's count. The authors also found a weakening trend in the intensity of the Siberian high in December and February, and linked it to the long-term decline in wind speed in those same months. February intensity fell by 0.1006 hPa a year, about twice as fast as the December decline.
The East Asian winter monsoon has also been treated as an index in international journals. In 2004, volume 17, issue 4 of the American Meteorological Society's Journal of Climate carried a paper proposing a new East Asian winter monsoon index. The study analyzed climatological mean fields for the winters of 1958/59 through 2000/01, examining sea level pressure, surface air temperature, 850 hPa winds, 500 hPa geopotential height and 300 hPa zonal wind. The index time series was computed from the winter of 1958 to the winter of 2000. In an SVD analysis of surface air temperature anomalies against 300 hPa zonal wind anomalies, the first mode explained 53.95% of the total.
The Gulf Stream and the AMOC: what NOAA and the Hadley Centre say
NOAA introduces the Gulf Stream as a strong, warm current in the western North Atlantic. It first flows north along the Florida coast, then turns east off North Carolina and heads northeast across the Atlantic. NOAA puts its average speed at 6.4 km/h, or 4 miles per hour, with the flow fastest at the surface, where it reaches a maximum of about 9 km/h. The current, NOAA writes, carries more water than all the world's rivers combined.
The currents tutorial from NOAA's National Ocean Service frames it a little differently, describing the Gulf Stream as a powerful western boundary current in the North Atlantic. Water originating in the Gulf of Mexico flows at roughly 1 to 3 knots, or 1.85 to 5.55 km/h. The tutorial also explains that the current shapes the climate of Florida's east coast, making winters warmer and summers cooler than in other southeastern states, and that it extends toward Europe and warms the countries of Western Europe. Because the two sources state speeds differently, it is safer to cite which page a figure comes from.
The Met Office Hadley Centre treats the Atlantic Meridional Overturning Circulation (AMOC) separately. In the AMOC, warm surface water moves north into the subpolar North Atlantic, cools and sinks, then flows south at depth. That northward heat transport, the Hadley Centre explains, gives Western Europe a mild climate compared with northeastern North America. The centre also notes that ocean heat content in the subpolar North Atlantic has declined since 2011, and has been below the 1991–2020 average since 2013.

Seoul and London Heathrow side by side
The observation sites are Seoul and London Heathrow; the sources are the KMA's regional climate statistics and the UK Met Office's station normals. In January, Seoul's monthly mean temperature is -1.9°C, while Heathrow's mean maximum is 8.42°C and its mean minimum 2.68°C. December at Heathrow brings a mean maximum of 8.79°C, a mean minimum of 3.08°C and 7.17 days of air frost. Seoul's December-to-February precipitation totals 67.6 mm, about 5% of its annual total. Across the year, Heathrow's mean maximum is 15.67°C, its mean minimum 7.83°C and its air frost count 26.99 days.
The reference period matters too. The UK Met Office also publishes 1981–2010 January normals for Heathrow: a mean maximum of 7.11°C, a mean minimum of 1.43°C and 10.47 days of air frost. Temperatures are lower and frost days higher than in the 1991–2020 figures — a useful reminder that the same station yields different numbers under a different normal period.
Winter indicators for Europe as a whole are public as well. The EU's Copernicus Climate Change Service reports a downward trend in the area of Europe experiencing sub-zero winter temperatures, which was well below average in 2025. Regions where ice days — days with maximum temperatures at or below 0°C — persist for two weeks or more are now limited to the northeast, Iceland and the Alps. The area with winter mean temperatures at or below 0°C has shrunk as well, confined to higher elevations in mountain regions. Europe, the service notes, is warming faster than any other WMO region, at roughly twice the global average rate.
Takeaways
Seoul's winter cold can be read through the KMA's account of the Siberian high and the northwest monsoon, and London's mild winter through NOAA's and the UK Met Office's accounts of the Gulf Stream and the AMOC's northward heat transport. A KMA press release puts the nationwide mean temperature for the 2024/25 winter at 0.4°C — close to the normal of 0.5°C, but 2.0°C lower than the previous year. Cold, dry northerly winds kept precipitation low, the release explains, while snow clouds formed by the expansion of the continental high and the air-sea temperature difference over the Yellow Sea moved in and brought frequent snow to western areas. Sea surface temperatures in the waters around Korea averaged 12.4°C that winter, 0.2°C above the recent 10-year average and the second highest.
Variability shows up in the record as much as severity does. The KMA explains that Korea has long shown the samhan-saon pattern, in which three cold days alternate with four warm ones. In January 2025, Seoul's daily mean temperature swung 14.9°C, from -9.7°C on the 9th to 5.2°C on the 25th. In February 2025, cold spells lasted more than a week on two occasions, driven in part by the development of Ural blocking as North Atlantic storm lows moved into the Arctic. Readers who want the primary material can find it on the KMA's climate statistics site and press releases, NOAA's National Ocean Service, the UK Met Office normals pages, and the American Meteorological Society's Journal of Climate database.