1. Why the same land looks different from map to map: where to begin
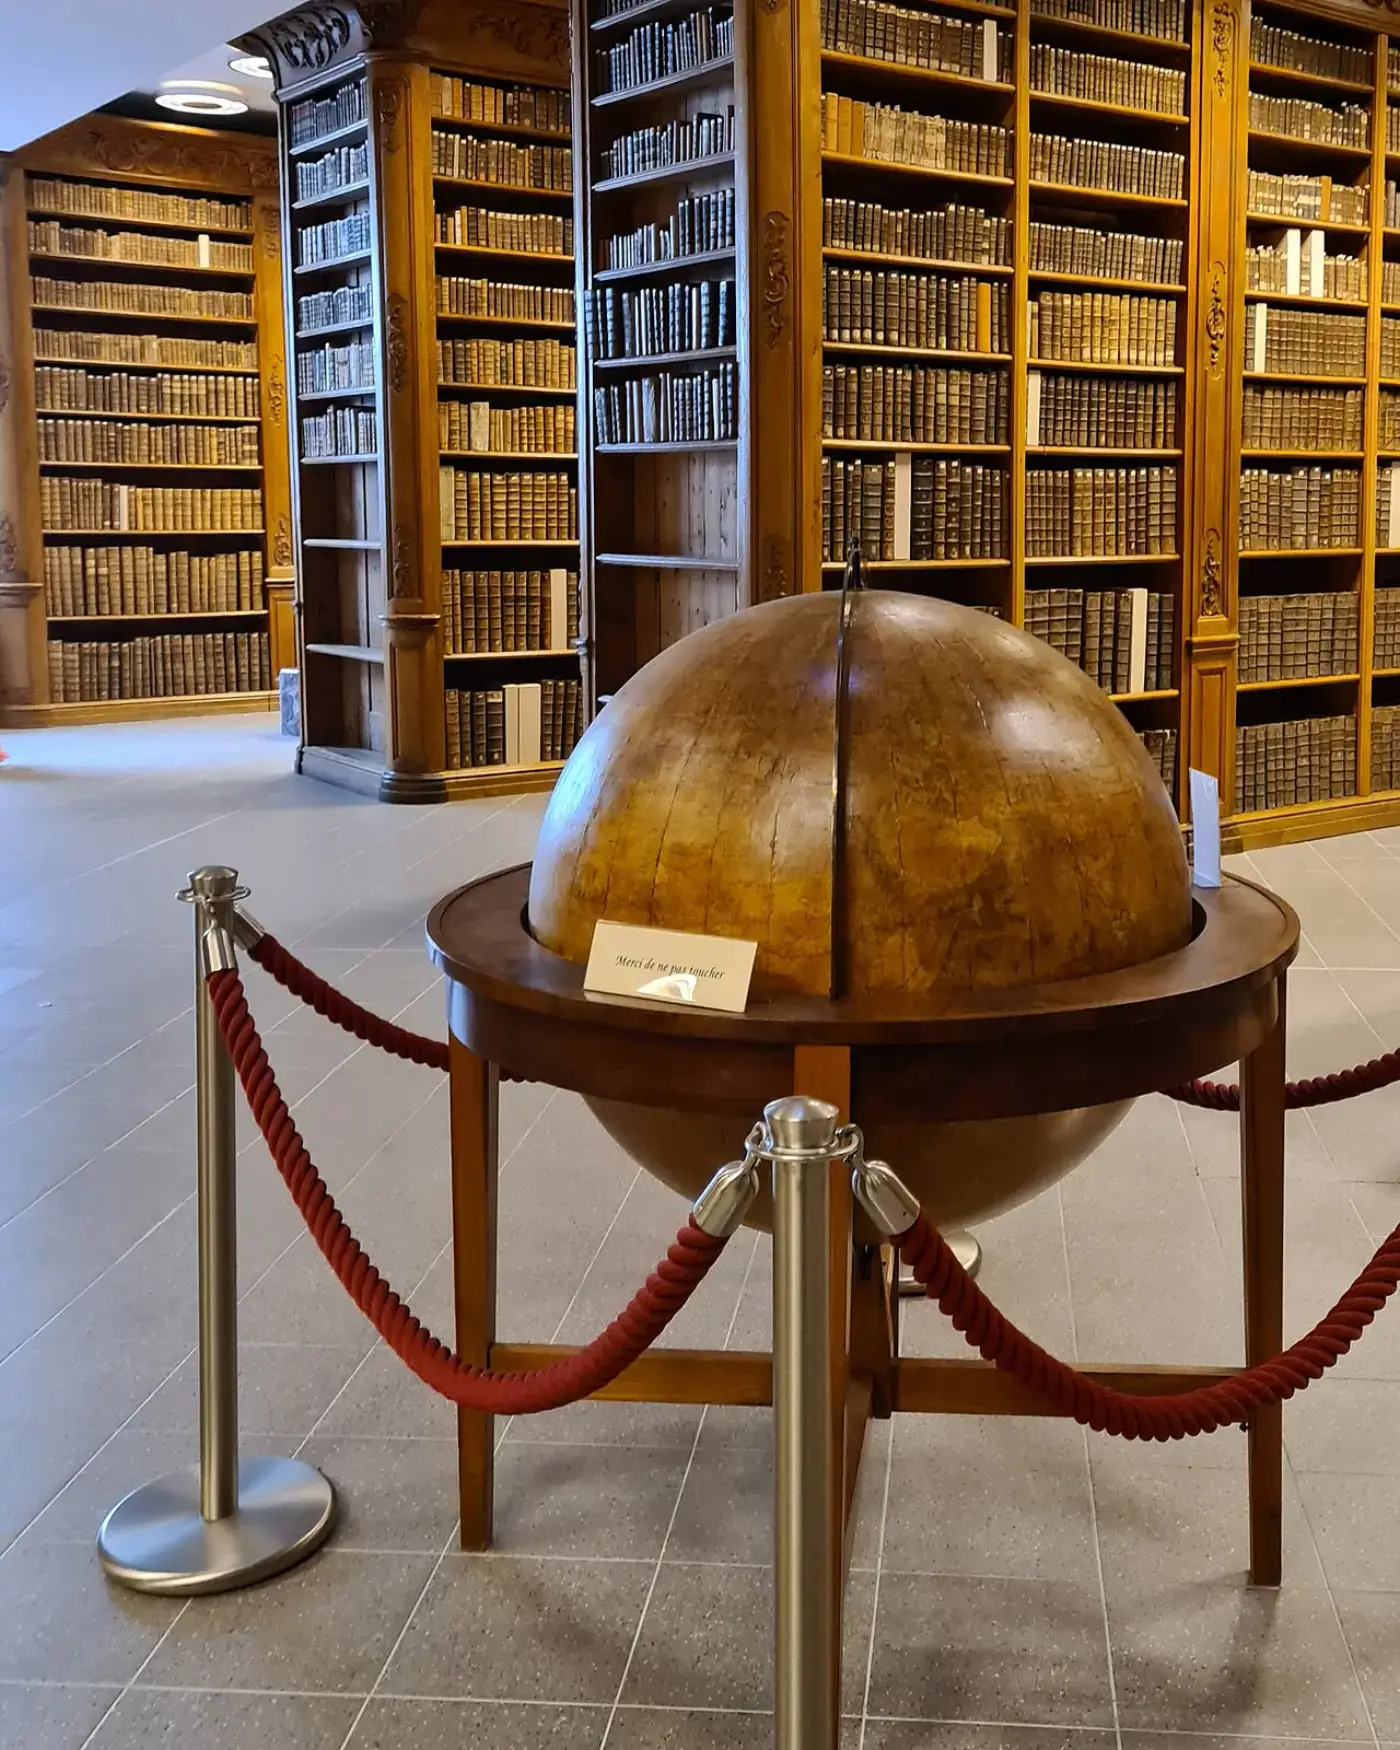
Look at a map long enough and you start to wonder how a round earth fits onto a flat sheet of paper. The US National Ocean Service, part of NOAA, which gathers data on the oceans and coasts, starts with exactly this problem in its explainer on making nautical charts. NOAA explains that the data collected about the ocean and coast represent a three-dimensional world, but a chart is a two-dimensional representation. In the same piece, NOAA notes that turning part of the earth into a flat chart requires a projection. Together, these two points suggest that understanding any map starts with how it was flattened.
This article proceeds as follows. First, it looks at NOAA's principle for choosing a projection, then at the Mercator projection most often used for nautical charts and the agency that makes those charts. Next, it uses the Ministry of Land, Infrastructure and Transport's cadastral statistics to show where a country's area figure comes from. It then sets out how Kim Jeong-ho's 1861 Daedongyeojido was made, and where it matches and departs from modern maps. Finally, it considers how to read maps made in different ways side by side.
2. NOAA's principle: no projection is perfect, so choose one for the job
NOAA explains that no map projection shows the world perfectly. Every projection creates its own distortions, so mapmakers must choose the one that suits their purpose. The key phrase is "its own." The point is less whether distortion exists than that each projection distorts in a different way.
This changes the habit of treating a map as the one right answer. A map can be seen not as a copy of reality but as the result of choices made for a particular purpose. So the first question to ask of a map becomes not "Is it correct?" but "What was it made for?" The fact that different purposes can call for different projections can be seen as an extension of the same principle.
3. The Mercator projection: NOAA's cylindrical chart projection in use since the 16th century
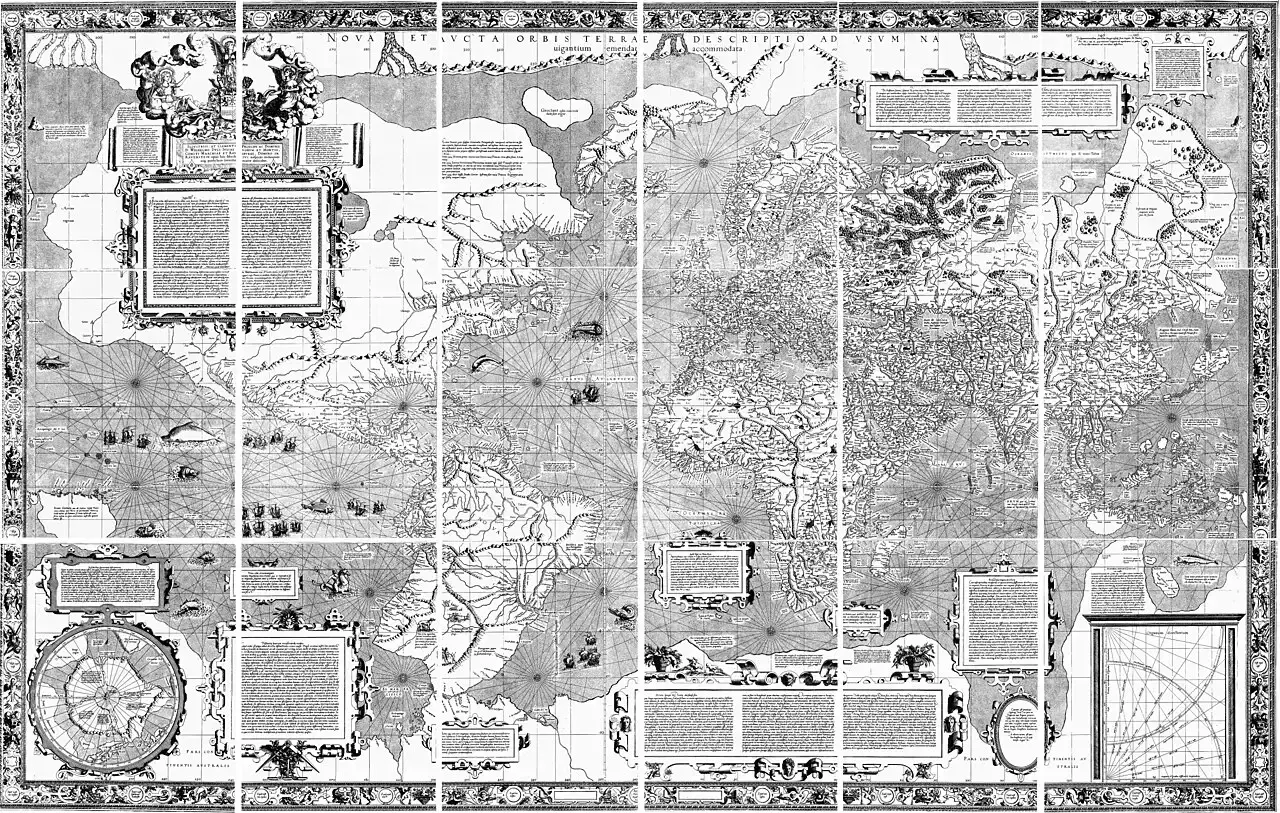
According to NOAA, the Mercator projection is a cylindrical projection, and it is the one usually used for nautical charts. On it, lines of latitude and longitude cross at right angles, and a constant compass bearing can be drawn as a straight line on the chart. NOAA also explains that mariners have used Mercator charts since the 16th century.
Read alongside the principle in the previous section, the Mercator projection can be seen not as a perfect picture either but as a projection chosen to suit nautical charts. NOAA's general rule that every projection has its own distortions can be taken to apply to Mercator as well. The features NOAA highlights are properties of its lines: parallels and meridians meeting at right angles, and constant bearings drawn as straight lines. This leads us to think of a Mercator map first as a tool for reading direction rather than as a picture for comparing the size of landmasses. Its use since the 16th century can be seen as an example of one projection being chosen for a particular purpose over a long period.
4. NOAA's Office of Coast Survey: the official US chartmaker and its choice of projection
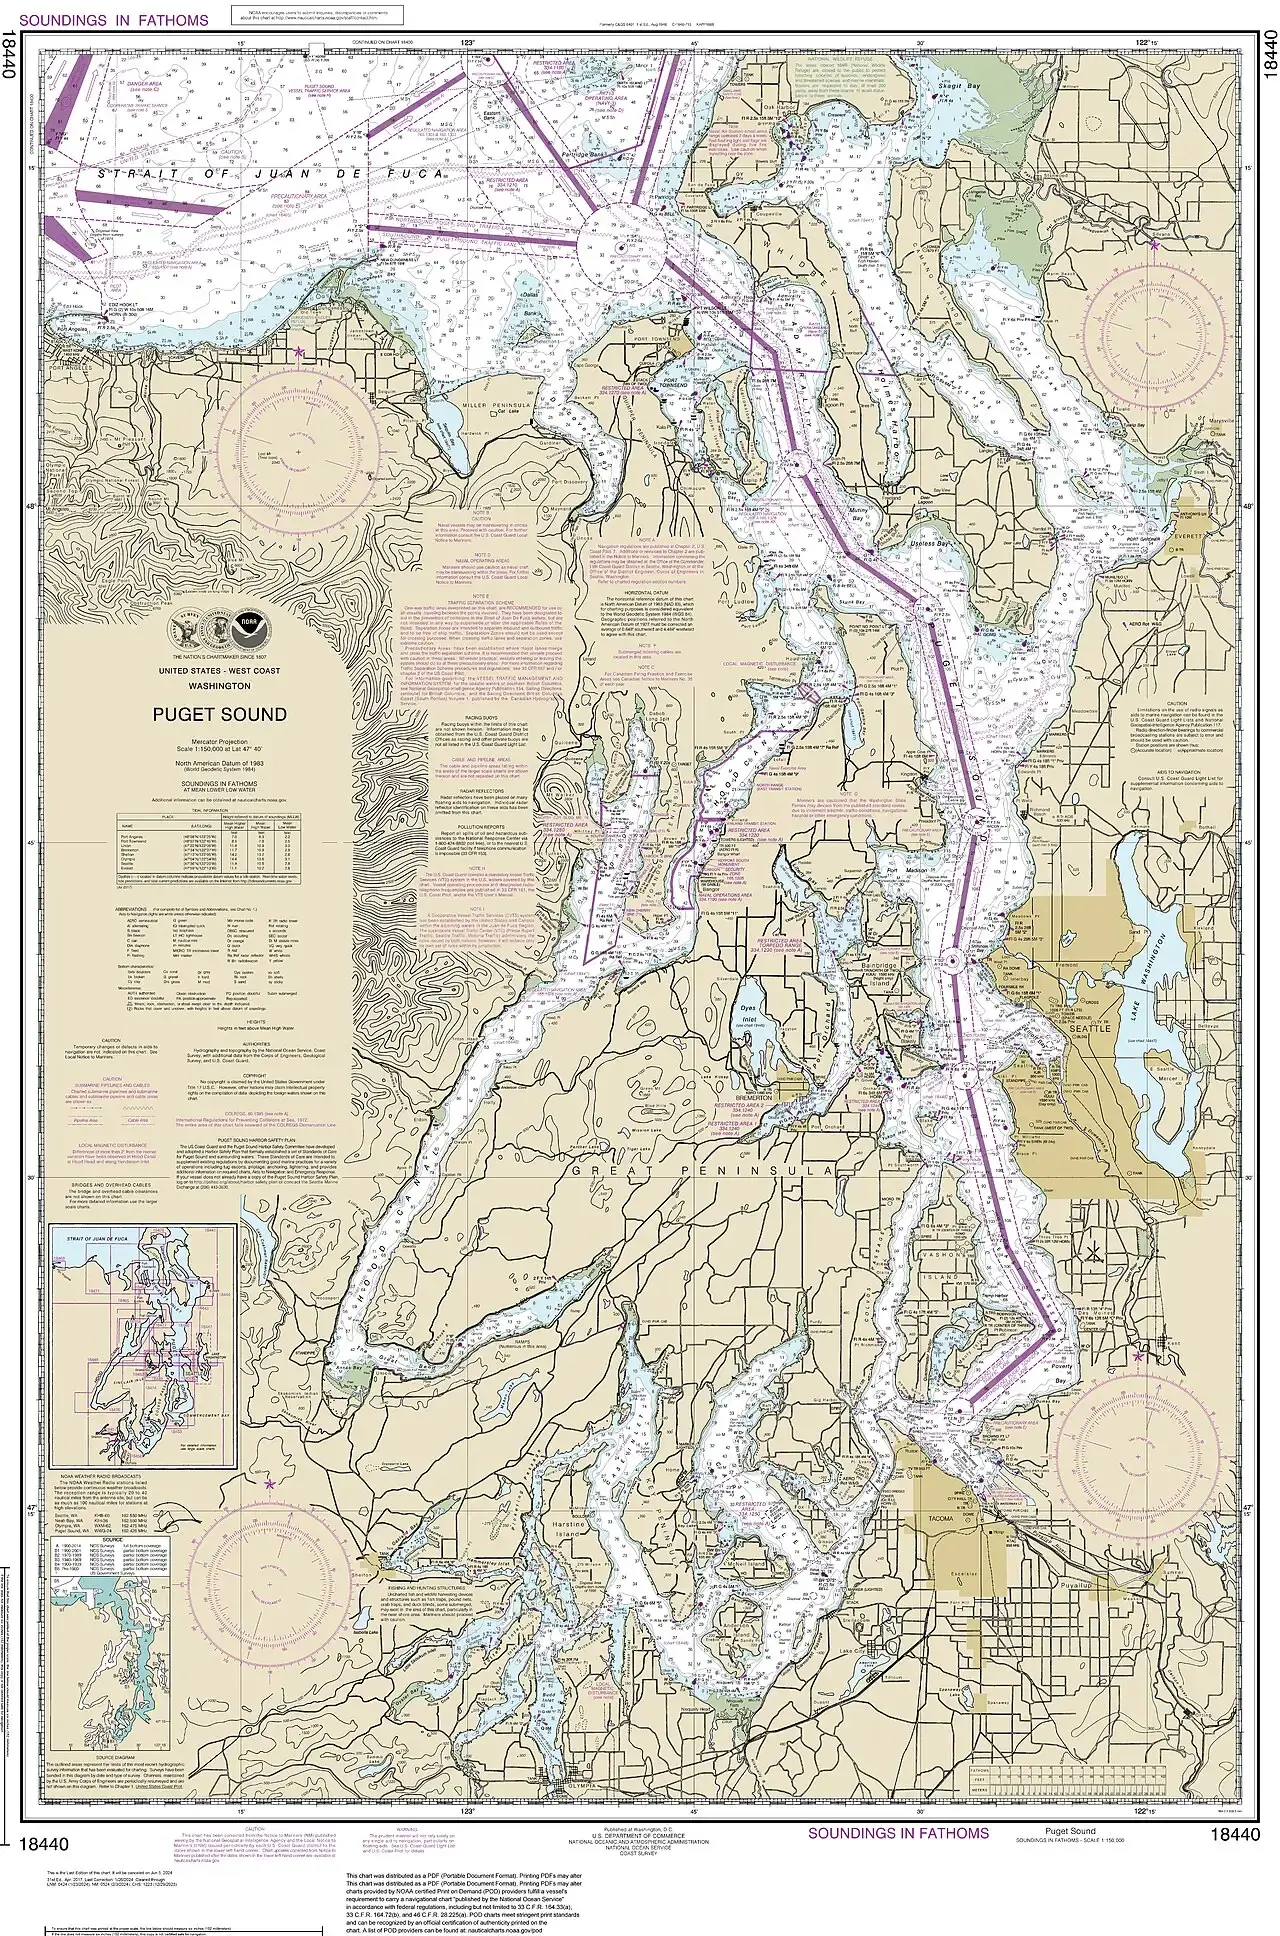
NOAA's Office of Coast Survey, part of the National Ocean Service, is the official nautical chartmaker of the United States. Notably, there is an agency dedicated to charts, and the service it belongs to explains the principles of choosing a projection to general readers. As noted above, NOAA states that nautical charts usually use the Mercator projection. The physical chart sits where the agency's work and the choice of projection meet.
This shows that projections are not just academic theory but practical choices made by government agencies. A single map carries with it the agency that made it and the job that agency does. For a chartmaking agency, "the projection that suits the purpose" means the projection that suits navigation. When you look at another country's official maps, starting with who made them and why can help you work out why they use the projection they do.
5. The Ministry of Land, Infrastructure and Transport's 2024 cadastral statistics: a registered land area of 100,449.4 km²
On April 1, the Ministry of Land, Infrastructure and Transport released its 2024 cadastral (地籍) statistics, which underpin national land policy and administration; the figures are as of December 31, 2023. NewsSeoul reported that the land area registered in the land and forest registers was 100,449.4 km², covering 39,632,000 parcels. The registered area grew by 5.8 km² from the previous year, which the report described as about twice the size of Yeouido. The increase was found to come from newly registered land created by various development projects, including the clean-up of unregistered land, reclamation of public waters and national fishing port projects.
These figures show that even a country's area is not fixed: it depends on what has been entered in which register. When reclamation or clean-up projects add registered land, the statistical area changes too. So if you want to find countries roughly the size of Korea, it is safer to check first which agency produced each figure and on what basis. Just as you check the projection on a map, with area statistics you check the reference date and how the figures were compiled.
6. Kim Jeong-ho's Daedongyeojido: an 1861 woodblock print, reissued in 1864, in 22 split-and-folded volumes
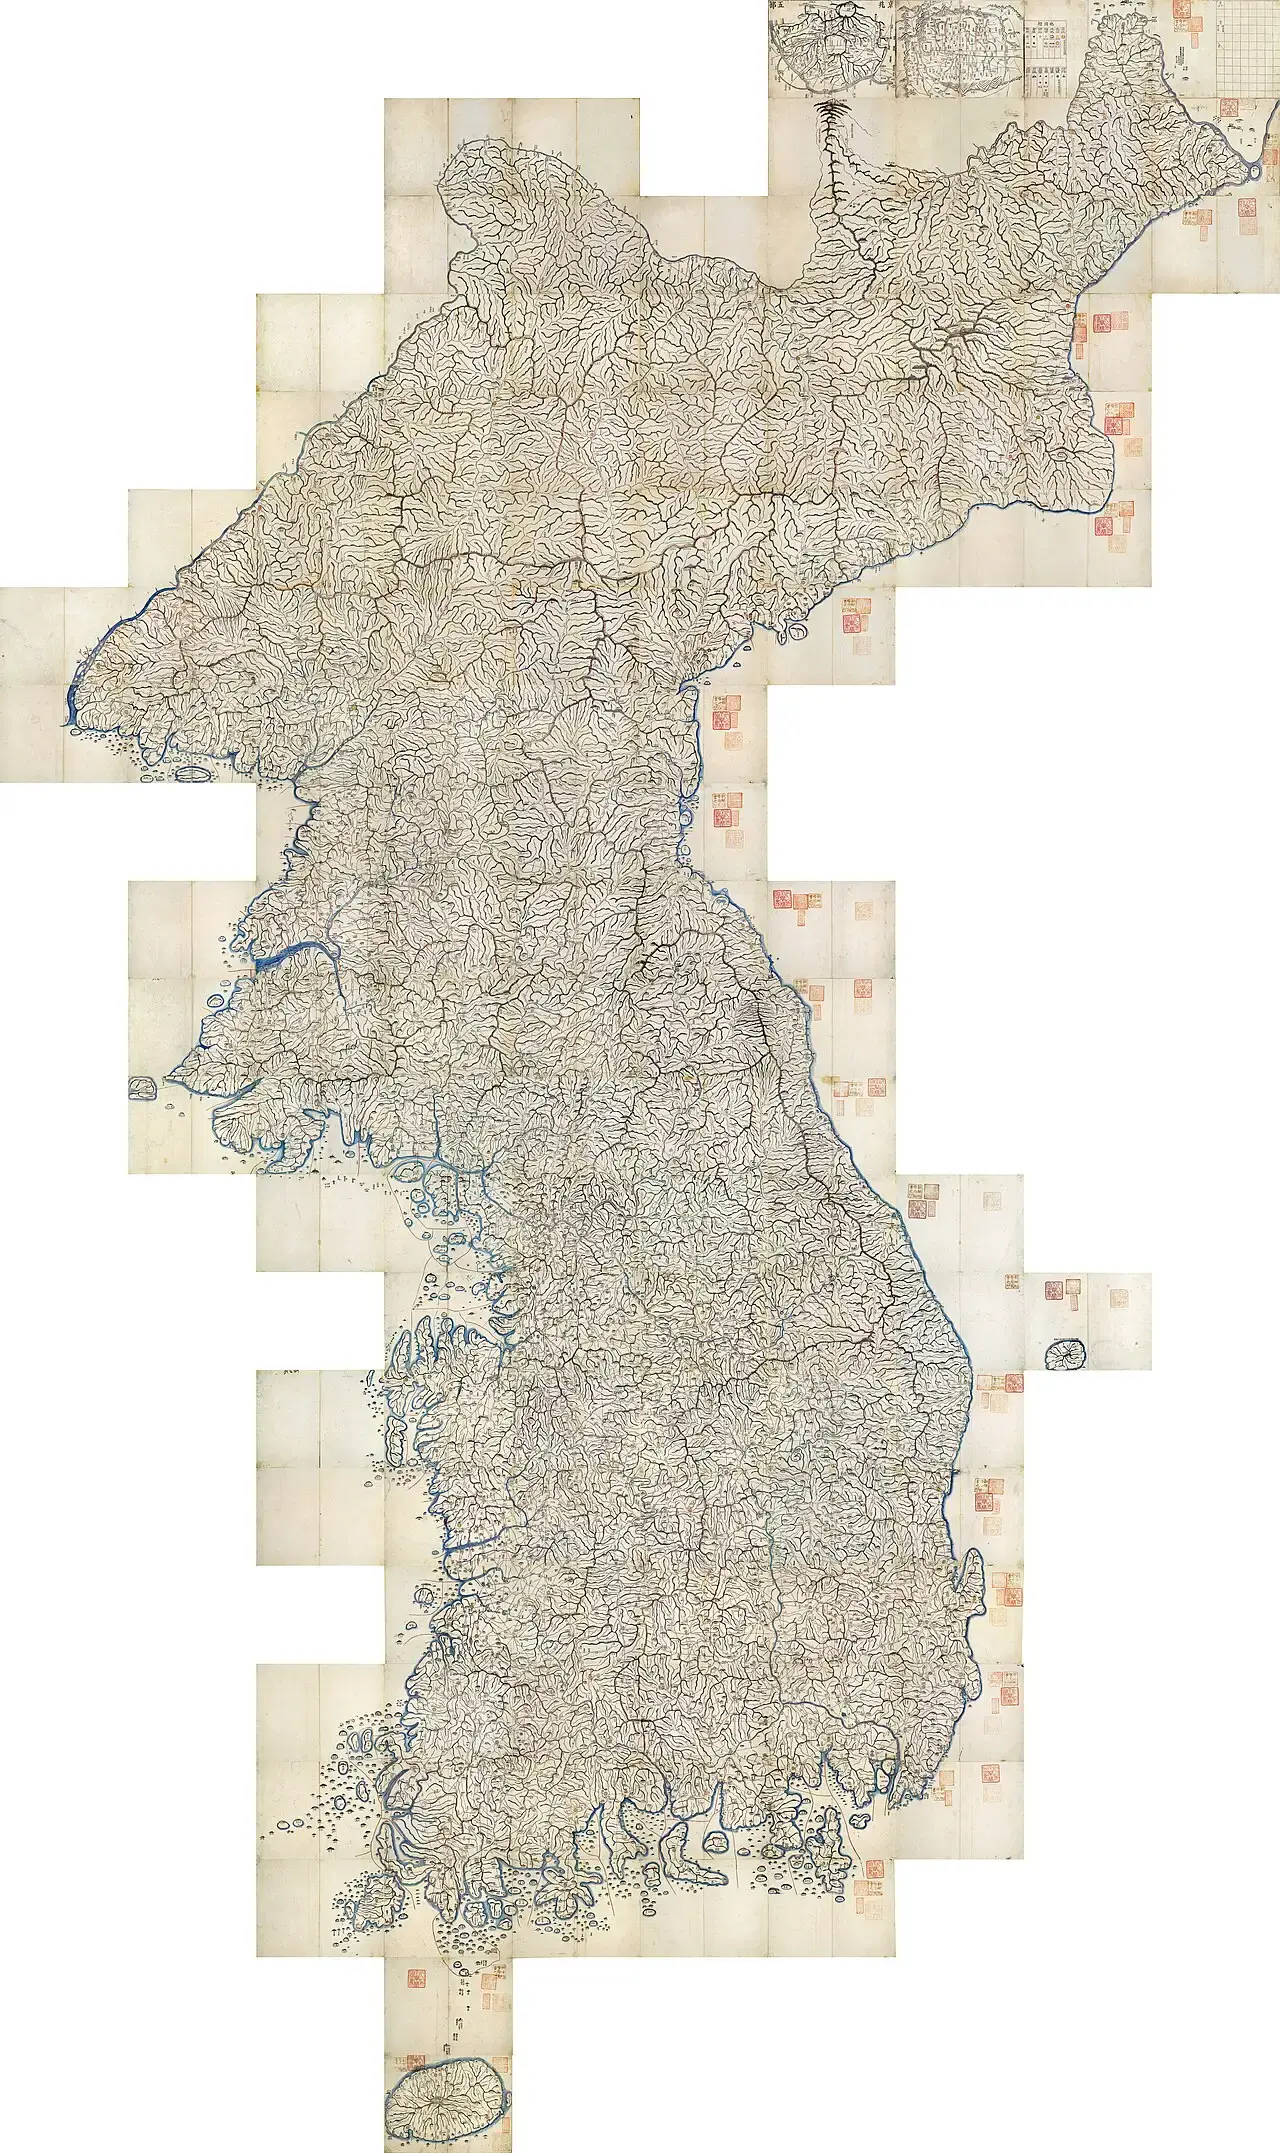
Gosanja (古山子) Kim Jeong-ho was a mapmaker thought to have been born around 1804 and to have died in 1866. According to the Encyclopedia of Korean Culture, published by the Academy of Korean Studies, the Daedongyeojido is a national atlas in a split-and-folded format that Kim produced as a woodblock print in 1861. The encyclopedia also includes a photograph of the 22-volume folding map reissued in 1864, laid out flat. Newsis reports that Kim first produced the hand-copied national maps Cheonggudo (靑邱圖) and Dongyeodo (東輿圖) and the geography Daedongjiji (大東地志), then drew those achievements together to complete the Daedongyeojido. This sequence presents the Daedongyeojido as the culmination of his earlier work on maps and geographies.
The Daedongyeojido divides the country into 22 north-south tiers, each made into a folding volume. Material from the National Museum of Korea, presented by the Ministry of Culture, Sports and Tourism, notes that joining all 22 volumes produces a large national map about 6.7 m tall and 3.8 m wide. The map starts at Baekdusan, draws the mountain ranges as connected lines and shows the rivers between them in detail. To distinguish them from the curving rivers, roads are drawn as straight lines, with a dot every 10 ri so that distances can be estimated. Administrative districts, military installations, walled towns and beacon stations are marked with symbols, and the opening includes a "map key" equivalent to the legend on a modern map. With more than 13,000 place names, it contains more than any other woodblock-printed map of the Joseon period.
The National Museum of Korea singles out woodblock printing as a defining feature of the Daedongyeojido, because it let more people carry and use the map easily. Two stories have long circulated about Kim: that the Heungseon Daewongun burned the woodblocks, and that Kim surveyed the whole country on foot, climbing Baekdusan repeatedly to take measurements. The Encyclopedia of Korean Culture states that the story of the burned woodblocks is groundless, since one block survives at the Soongsil University Museum and 11 at the National Museum of Korea. It adds that there is little evidence for the nationwide survey or the Baekdusan measurements. In addition, the facsimile released by the National Museum of Korea in 2026 shows Dokdo next to Ulleungdo, although it does not appear on the original, so the original and the facsimile should be kept distinct. These facts present the Daedongyeojido less as a heroic tale than as an achievement of compilation and printing.
7. How accurate is the Daedongyeojido? A 2.5 cm 10-ri grid and errors in Hamgyeong Province
The Encyclopedia of Korean Culture explains that the Daedongyeojido is not a map that applies a projection based on modern surveying, as modern maps do. The lines of the grid table it was based on are not latitude and longitude in the modern sense but a grid drawn on a flat surface, like a go board. The Daedongyeojido used a 10-ri grid, with every square a uniform 2.5 cm. In other words, the whole map was laid out on a grid of equal squares.
On accuracy, the encyclopedia notes that compared with modern maps, large errors appear in the north, especially in Hamgyeong Province. Apart from parts of the north, however, the map closely matches the outline of the Korean Peninsula on modern maps. The sources for this article give no figures for errors in position or coastline, so the size of the errors is not stated here as a number. Rather than labelling the map simply accurate or inaccurate, this assessment invites readers to see both where it matches and where it departs.
The Mercator projection discussed earlier is what NOAA describes as a cylindrical projection. The Daedongyeojido, by contrast, was based not on a projection but on a grid on a flat surface. Projecting the earth onto a flat chart and placing land on a grid of fixed distance units start from different premises. Even so, the two are worth reading side by side, because both arranged their lines to meet the needs of their users, whether by drawing bearings as straight lines or by marking a dot every 10 ri.
| Category | Mercator chart (NOAA) | Daedongyeojido (Encyclopedia of Korean Culture, National Museum of Korea) |
|---|---|---|
| Underlying method | Cylindrical projection | Not a projection but a grid on a flat surface: a 10-ri grid (2.5 cm per square) |
| Lines | Latitude and longitude cross at right angles; constant compass bearings drawn as straight lines | Roads drawn as straight lines, with a dot every 10 ri for estimating distance |
| Period of use | Used by mariners since the 16th century | Produced as a woodblock print in 1861; reissued in 1864 |
| Format | Flat, two-dimensional chart | 22 north-south tiers in split-and-folded volumes; about 6.7 m × 3.8 m when joined |
| Distortion and error | Every projection has its own distortions | Large errors in the north, especially Hamgyeong Province; elsewhere closely matches the peninsula's outline |
8. Conclusion: one world, many maps
First, every map can be read as a different way of flattening the single, round earth. As NOAA says, no projection is a perfect picture, and each has its own distortions. Just as Mercator charts are used to draw constant bearings as straight lines, every map puts some purpose first. So rather than trusting a single map, it pays to read its projection and purpose together. Area statistics, too, become clearer in meaning when read with their reference date and registration method.
Second, old maps such as the Daedongyeojido can be seen as attempts to depict the land with the methods of their time. Using a 10-ri grid instead of a projection, splitting the map into 22 folding volumes and printing it from woodblocks so it could be carried easily all reflect a design made with users in mind. Keeping in mind both the large errors in the north, including Hamgyeong Province, and the close match of the outline elsewhere lets us read old maps alongside modern ones, as neither myth nor failure. Along the way, groundless stories such as the burning of the woodblocks get filtered out.
Third, however differently maps are drawn, land and sea form one connected whole, and in that sense the world is one. The gap NOAA describes between the three-dimensional world and the two-dimensional chart is a reminder that a map is not the world itself but a record transcribed from it. American nautical charts and the Joseon atlas differ in method and era, yet both are efforts to capture the same land and sea on a flat surface. The more maps we read together, the more clearly the single world beyond them comes into view.
Related reading: Gyeonghuigung Palace: Why Was It Called the Western Palace, and Why Is It So Small Today? (5/7) · When Did UNESCO List Haeinsa's Janggyeong Panjeon and the Tripitaka Koreana? (2/17)